Vulnerability Management 101 starts with a blunt truth: “Critical” isn’t a patch plan
“Critical” severity labels look impressive, but they don’t tell you what to patch first in your environment. I’ve watched teams spend weekends pushing the loudest CVEs while the real risk sat in an older app that no one owned.
Vulnerability management is about reducing real-world exposure, not chasing scores. A patch prioritization model helps you turn messy inputs (asset reality, exploit info, business impact) into a simple order of action you can defend to leadership and prove with metrics.
In this guide, I’ll show you how to build a patch prioritization model that fits how organizations actually run in 2026—mixed cloud and on-prem, imperfect inventory, slow change windows, and teams that don’t all speak the same “security” language.
What vulnerability management 101 means in practice (not in a slide deck)
Vulnerability management refers to the process of finding, assessing, prioritizing, and fixing security weaknesses across your systems. It also includes proving you fixed them and learning what failed in the process.
Most programs break at the same points:
- Discovery is noisy. Scans find things you can’t patch (end-of-life software, false positives, dev machines).
- Prioritization is too generic. The model ignores what runs on your network and who relies on it.
- Remediation is unpredictable. Ownership is unclear, change windows are missed, or patching breaks apps.
Here’s the shift I recommend: treat patching like a supply chain. You need inputs (data), routing rules (priority model), and tracking (what changed and when).
Design the inputs: your model is only as good as your asset truth
The fastest way to build a broken patch prioritization model is to score vulnerabilities without knowing what actually exists. Your first job is to tighten asset data so your prioritization math has something real to stand on.
Build an “asset reality” view (because scans lie a little)
In real environments, asset inventory is always imperfect. You’ll have stale CMDB records, cloud instances with no CMDB entry, and “temporary” servers that never die.
I usually start with three sources and merge them:
- Vulnerability scanner exports (host, port/service, detected software/version).
- CMDB or ITSM records (owner, cost center, business service mapping).
- Endpoint + patch management logs (installed updates, last scan time, patch compliance).
Even if you don’t have all three, start where you can. The goal isn’t perfection; it’s reducing obvious mismatches (like scoring a vulnerability on a machine that’s been decommissioned for six months).
Normalize “software identity” so you don’t score phantom risk
Vulnerability data often uses one versioning scheme and your environment uses another. For example, scanners may report “Java 8u202” while your patch system logs only “Java 8 Update 381.”
You need a normalization step. At minimum:
- Map scanner product names to your internal names (Java, OpenJDK, Tomcat, etc.).
- Convert versions into a consistent format (major.minor.update).
- Flag “uncertain detection” cases so they don’t get equal priority to confirmed installs.
In one 2025 project I worked on, version mismatches alone explained almost 30% of “patch success” tickets that were later marked as “not applicable.” Fixing identity mapping cut that waste in half.
Create the prioritization model: score risk based on your exposure, not global hype

Your patch prioritization model should produce a single, explainable priority per vulnerability per asset (or per service). The output has to make sense to the people who will actually patch.
I recommend a weighted model with clear categories. You can do this in a spreadsheet first. If you later move to a tool, the logic stays the same.
Step-by-step: build a practical scoring rubric
Here’s a rubric I’ve used for mixed enterprise environments. It balances exploit reality, asset exposure, and business impact.
1) Confirm vulnerability applicability (base gate)
Gate 1: Is the vulnerable product confirmed on the asset? If the scan is uncertain, downgrade the score.
- Confirmed: full score potential
- Probable: reduce by 25–40%
- Uncertain/guessed: reduce by 60–80% or treat as “needs verification”
This gate prevents your model from ordering patches for software that isn’t really there.
2) Model exploit likelihood (weaponization + internet exposure)
“Exploit available” matters, but not all exploits are equal. A remote internet-facing service is a different risk than the same issue in a closed admin network.
Use a simple factor:
- Publicly exploited (seen in threat intel or reliable reports): high score
- Exploit exists (public PoC or Metasploit module): medium-high
- No known exploit: medium or low
- Local-only with no privilege escalation path in your context: reduce
If you want sources, pair your scanner feed with threat intel you trust. If your team already covers Threat Intelligence, pull exploit status from those posts and keep it current.
3) Estimate exposure (attack surface and reachability)
Exposure is where most generic CVSS-based lists fail. CVSS doesn’t know your network rules.
Score exposure by asking:
- Is the service reachable from the internet or partner networks?
- Is it internal but broadly reachable (flat networks, permissive firewall rules)?
- Is it restricted (jump hosts, allowlists, VLAN isolation)?
If you have firewall logs or network flow data, even better. If not, use ownership + network topology knowledge. Security knows policies; app owners know usage patterns.
4) Add business impact (what breaks if it’s attacked or fails to patch)
Business impact is not “how scary the vulnerability sounds.” It’s how the system supports revenue, safety, operations, or patient/customer data.
Pick a small list of impact types:
- Customer-facing services (web, API, SSO)
- Internal critical path services (identity, payroll, manufacturing control interfaces)
- Data sensitivity (PII, PHI, payment data, IP)
- Recovery difficulty (high cost, long restore time)
This is where your patch model becomes convincing. When you can say “this patch closes the fastest path to account takeover of customer-facing identity,” it’s easier to get approvals.
5) Include remediation friction (what makes patching slow or risky)
Here’s my original angle that most people miss: your patch order should also consider remediation time and risk of change.
Some vulnerabilities are high impact but hard to fix quickly (legacy apps, rare maintenance windows). If your model ignores friction, you get a backlog of “critical” issues that never move.
Add a friction factor based on:
- Patch method (agent-based vs. manual vs. OS image rebuild)
- Reboot required (and how often you can reboot safely)
- Test cycle length (hours vs. days)
- Known patch issues with that app stack
Then adjust priority so you pick the actions that reduce risk fastest, not just the ones that score highest on day one.
Turn the rubric into a model output teams can use: Priority tiers + SLAs
A model that outputs a floating number isn’t very helpful when people are looking for “what do we do next Tuesday?” You need tiers and timelines.
Use priority tiers tied to clear SLAs
In one org, we used four tiers. Here’s an example you can copy and adjust.
| Priority Tier | What it means | Target remediation time (example) | Default action |
|---|---|---|---|
| P1 | Confirmed exploitable, internet/partner reachable, high business impact | 7–14 days | Patch or emergency workaround + monitoring |
| P2 | Exploit exists or high impact, but limited exposure or partial reachability | 30 days | Patch in next change window |
| P3 | High severity but uncertain applicability or lower business impact | 60–90 days | Verify, then patch as scheduled |
| P4 | Low exposure, no exploit info, or compensating controls reduce risk | Next quarter | Track, accept with review, or plan upgrade |
Notice what we don’t do: we don’t say “everything critical is P1.” That’s how you lose months.
What most people get wrong: treating patching like a one-dimensional list
Common failure patterns:
- Only using CVSS. CVSS doesn’t know if your service is reachable or whether the affected software is even installed.
- No verification stage. You waste time patching “ghost” findings or rejecting true findings due to scan quirks.
- Ignoring exceptions. End-of-life products need a different strategy (compensating controls, isolation, rebuild plans).
- Not tracking patch outcomes. If you don’t measure “time to remediate” and “closure quality,” your model becomes a guess.
I’ve learned that good prioritization is half math and half operations discipline.
Handle real-world complexity: exceptions, compensating controls, and end-of-life systems
Every vulnerability program hits cases where you can’t patch quickly. If you handle those cases well, your model becomes usable instead of frustrating.
How to score “workaround first” cases without faking progress
For some issues, the fastest safe action is a workaround: disable the vulnerable feature, block the port, restrict access, or add WAF rules.
Your model should allow a “mitigation status” so you can reduce risk even before the patch lands.
Use a status ladder:
- Not started
- Mitigation in place (firewall rule, config change, WAF signature)
- Patch in progress
- Patched
- Validated (scanner confirms fixed + service checks pass)
That last “validated” step is key. I’ve seen teams patch and then discover the app reverted after a failed deployment.
What to do with end-of-life (EOL) software
EOL is where patch prioritization becomes an upgrade plan. If there’s no vendor patch, your model can’t treat it like a normal “fix in 30 days” issue.
My approach for EOL:
- Score based on exposure and business criticality, not on vendor availability.
- Require a compensating control plan (network isolation, access restriction, compensating monitoring).
- Set a separate timeline category tied to migration work, not patch windows.
This is one reason I like keeping vulnerability management linked with your Tutorials & How-To content on change management and deployment practices. Patch work is still IT work.
Implementation plan for 30 days: from raw findings to a working patch queue

You don’t need a perfect system to start. You need a working workflow that creates an actionable queue and closes the loop.
Week 1: Create the pipeline and define ownership
Start with one asset group, not your whole network. Pick a segment that matches a real risk area: for example, “public web apps and their supporting services.”
- Export the last 30 days of scanner findings for that segment.
- Join findings to asset data (owner, service mapping, patch tool coverage).
- Create a list of service owners who can approve patch plans.
If you can’t identify owners, prioritize only after ownership is set. Otherwise your tickets stall and the model is just reporting.
Week 2: Build the scoring rubric in a spreadsheet first
Implement the rubric using columns for each factor: applicability gate, exploit likelihood, exposure, business impact, and friction.
Then output a tier. Give each factor a weight and keep the weights simple. A model that uses 10 formulas but explains nothing is a model no one trusts.
Test it on last month’s most painful incidents. If your model would have ordered them correctly, you’re on the right track.
Week 3: Produce a patch queue and run “verification drills”
Create a prioritized patch queue (top 25–50 items) with:
- Suggested action (patch, workaround, upgrade plan)
- Target tier and SLA
- Dependencies (reboot needed, maintenance window, service downtime concerns)
- Owner and due date
Run verification drills on a subset. For example, verify 10 high-priority items by checking the actual application versions on the host, not only what the scanner reports.
Week 4: Measure outcomes and tune weights
At the end of the month, calculate two metrics:
- Time to remediate by tier (P1, P2, etc.).
- Closure quality: did the vulnerability actually disappear from scans and pass service checks?
Then tune weights. For instance, if “exploit likelihood” causes too many false alarms, reduce it. If “exposure” didn’t separate the internet-facing stuff well enough, increase that weight.
Tooling notes for 2026: where products fit and where they don’t
Most teams use vulnerability scanners, ticketing systems, and patch tools. The scoring model can live in a dashboard, a ticket automation workflow, or a small rules engine.
What I recommend mapping to your stack
Here are common tool types and how the model connects:
- Scanner (e.g., Tenable, Qualys): provides findings and version evidence.
- Threat intel: provides exploit status and known active campaigns.
- ITSM (ServiceNow, Jira): stores tickets and workflow states.
- Patch management (Microsoft SCCM/Intune, Tanium, Ivanti): supports remediation tracking.
The model shouldn’t be tied to one vendor’s scoring system. If you depend on a single vendor’s risk score, you’ll end up fighting it later.
Where patching pipelines fail: testing and rollback gaps
Even with a perfect priority list, patches fail when you can’t safely deploy. For 2026, standard best practice in many orgs is:
- Use staged rollouts for major server groups.
- Keep a rollback plan (or at least a “forward fix” plan).
- Require app-owner validation for high-risk stacks (SSO, databases, message brokers).
If you don’t have those controls, the friction factor should be heavier in your prioritization model.
People also ask: patch prioritization and vulnerability management questions
How do you prioritize vulnerabilities when everything looks critical?
You prioritize based on confirmed applicability, exploit reality, exposure, and business impact—not on severity labels alone. Then you add remediation friction so you choose actions that reduce risk fastest.
My practical rule: if a finding is uncertain, it’s not a P1. You can make it P2 or “verify first” so the team investigates quickly without burning patch windows on ghosts.
What’s the best patch prioritization model for small businesses?
For small businesses, keep it simple: focus on internet-facing systems, identity tools, and anything that stores customer data. Use a two-tier model (Fix now vs. Fix next) unless you have multiple release schedules.
Small teams also benefit from a “verification checklist” because scans can be wrong. If you can’t verify in under 24 hours, treat it as lower priority until you confirm.
Should you use CVSS scores or build your own risk model?
Use CVSS as a starting point, but don’t stop there. CVSS is a math score based on exploit and impact assumptions, not your network reachability, your asset inventory accuracy, or your change constraints.
Build your own model around your real environment: reachability, ownership, and operational risk.
How do you handle vulnerabilities with no available patch?
When there’s no patch, you switch to compensating controls. That means isolation, access restrictions, configuration changes, WAF rules, or monitoring improvements.
Your model should reflect this by changing the remediation status to “mitigated” and setting a separate timeline for upgrade or replacement.
Conclusion: Build a patch prioritization model that reduces real risk, not just scan counts
The goal of vulnerability management 101 isn’t to clear dashboards. It’s to reduce the chance that attackers can use weaknesses against the systems that matter to your business.
Here’s your actionable takeaway for the next 30 days:
- Create asset truth for one scope (a real segment you own).
- Build a scoring rubric with five factors: applicability, exploit likelihood, exposure, business impact, and remediation friction.
- Output priority tiers with SLAs and require validation (scanner + service checks).
- Measure time to remediate and closure quality, then tune weights.
If you do that, you’ll stop treating “critical” as a command and start treating patching like a plan. That’s how vulnerability management becomes something your teams can actually run every month in 2026.
Internal reads you’ll likely want alongside this:
- How to Set Vulnerability Management Baselines That Aren’t Just Numbers
- Turning Threat Intelligence Into Patch Decisions (Not Just Alerts)
- Patch Management and Change Windows: How to Avoid Breaking Production
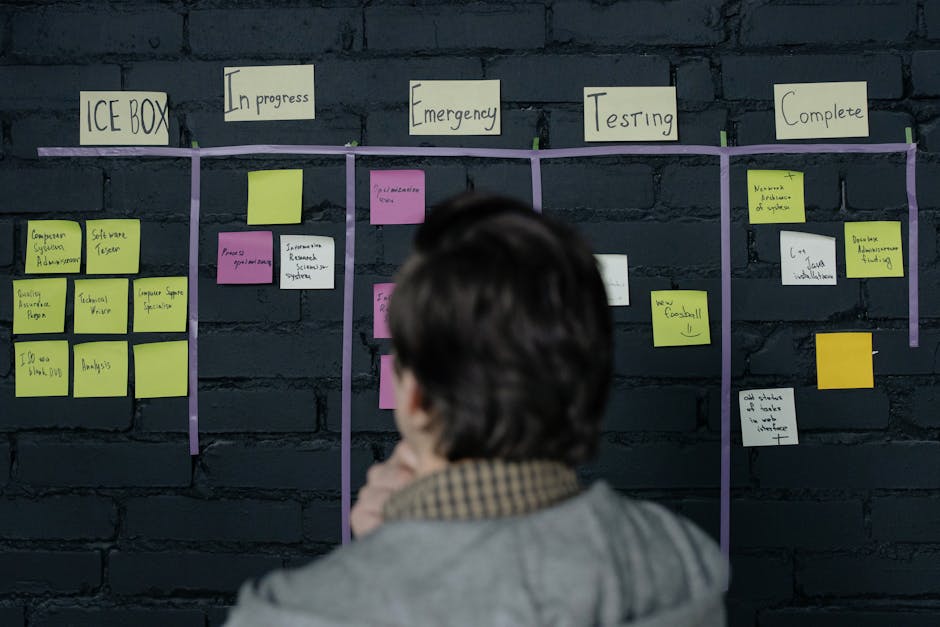
Featured image alt text suggestion: Vulnerability management patch prioritization model diagram showing risk tiers and SLA timelines